
Business Intelligence

Business Intelligence
Our LogStar Business Intelligence (BI) solution puts all your business data squarely in the hands of the end-users. Give your decision makers the visibility and control they need anytime, anywhere to analyze and optimize all your business processes. LogStar BI is easy to use, comes with many built-in dashboards and has connectors to all major TOS and ERP products.
A customized BI solution is a complete user driven framework that enables you to create Cubes, Dashboards, Charts, Reports on the fly in a simple and easy to use interface. It’s a Web based and is readily accessible on your tablet or mobile device across platforms and devices. It’s a simple, low cost, effective solution to make sense of all your data needs.
Features
- TOS and ERP connectors
- KPI Reporting
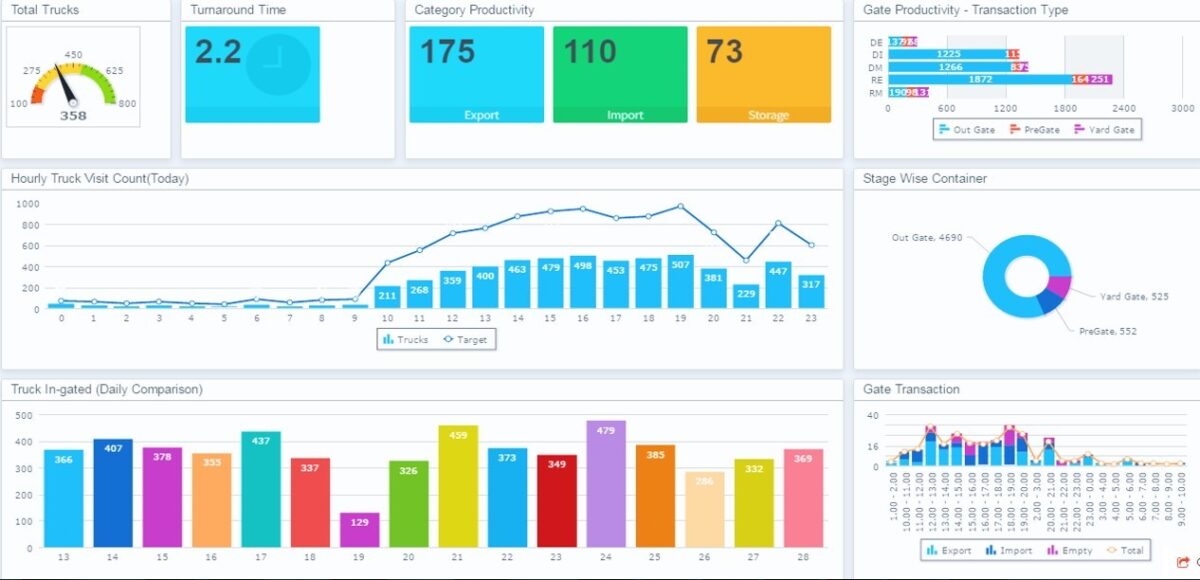
- Track, control and visualise your entire Terminal activities at one glance.
- Monitor real-time visibility of Berth Performance, Crane Performance and Vessel’s throughput, yard and gate analysis.
- Ready Dashboards for Operations, Commercials, Finance, Terminal Asset Management and Workforce Management
- Engineering excellence with Terminal Down-time Analysis and Asset Cost Analysis
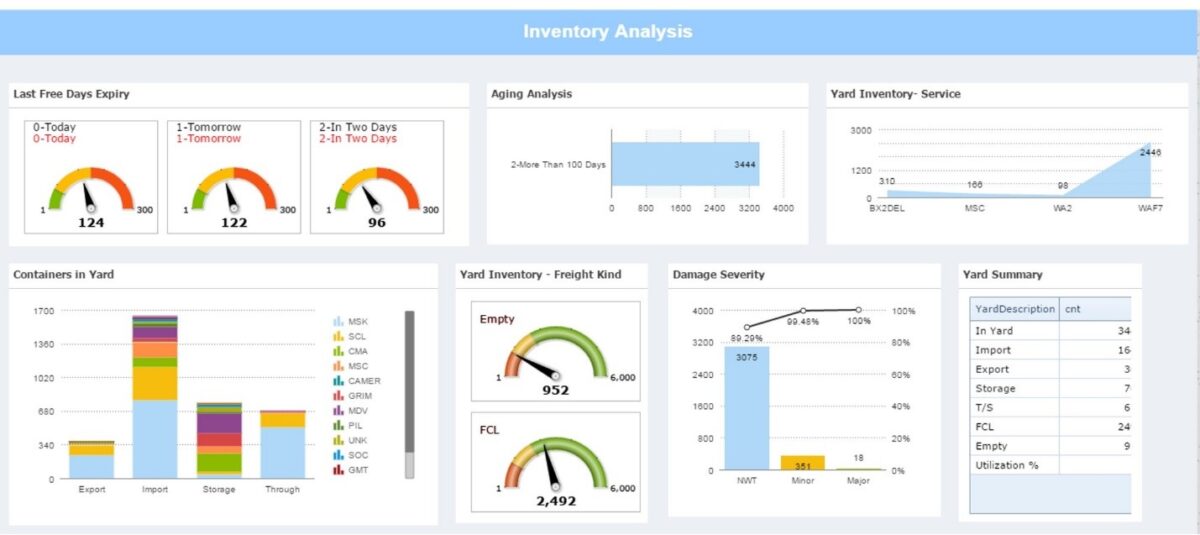
- Yard Inventory Analysis, Yard Equipment Analysis and Gate Operation Analysis
- Multi-Level Drill Down features to support management by exception
- Access on Mobile, Analyse and Visualize Data Anywhere, Anytime
- Graphically Rich Dashboards like Performance Indicators, Charts, Data Grids, Tabular, Live Ticker, Cards and analytical Cubes
- Business insight of all functional areas in Ports and Terminals
Benefits
- Single source of truth
- Real-time data availability
- End to end business performance management